PROFILEINFODETAILED contains detailed profiling info obtaining during exectution of some code. More...
Inheritance diagram for mxberry::dev::prof::ProfileInfoDetailed:

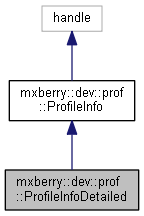
Collaboration diagram for mxberry::dev::prof::ProfileInfoDetailed:
Public Member Functions | |
| function | ProfileInfoDetailed () |
| PROFILEINFODETAILED is constructor of ProfileInfoDetailed class. More... | |
| function | tic (in self) |
| TIC starts a stopwatch timer and begins profiling. More... | |
| function | toc (in self) |
| TOC ends profiling and stops the timer, returning the time elapsed in seconds. More... | |
| function | getProfileInfo (in self) |
| GETPROFILEINFO returns structure containing info on profiling. More... | |
| function | process (in self, in varargin) |
| PROCESS takes info obtaining during profiling calculates a total run time and generates a report. More... | |
 Public Member Functions inherited from mxberry::dev::prof::ProfileInfo Public Member Functions inherited from mxberry::dev::prof::ProfileInfo | |
| function | ProfileInfo () |
| PROFILEINFO is constructor of ProfileInfo class. More... | |
| function | tic (in self) |
| TIC starts a stopwatch timer and begins profiling. More... | |
| function | toc (in self) |
| TOC ends profiling and stops the timer, returning the time elapsed in seconds. More... | |
| function | process (in self, in profCaseName) |
| PROCESS processes obtained profile info. More... | |
Private Attributes | |
| Property | StProfileInfo |
Detailed Description
PROFILEINFODETAILED contains detailed profiling info obtaining during exectution of some code.
Definition at line 5 of file ProfileInfoDetailed.m.
Constructor & Destructor Documentation
◆ ProfileInfoDetailed()
| function mxberry::dev::prof::ProfileInfoDetailed::ProfileInfoDetailed | ( | ) |
PROFILEINFODETAILED is constructor of ProfileInfoDetailed class.
*  Usage: self=ProfileInfoDetailed()
*
- Copyright
- 2015-2016 Peter Gagarinov, PhD
2015 Moscow State University
Faculty of Computational Mathematics and Computer Science
System Analysis Department
Member Function Documentation
◆ getProfileInfo()
| function mxberry::dev::prof::ProfileInfoDetailed::getProfileInfo | ( | in | self | ) |
GETPROFILEINFO returns structure containing info on profiling.
*  Usage: StProfileInfo=getProfileInfo(self)
*
*  input:
*    regular:
*      self: ProfileInfoDetailed [1,1] - class object
*  output:
*    regular:
*      StProfileInfo: struct [1,1] - structure containing the
*          current profiler statistics (see help for PROFILE
*          section PROFILE('INFO') for details)
*
◆ process()
| function mxberry::dev::prof::ProfileInfoDetailed::process | ( | in | self, |
| in | varargin | ||
| ) |
PROCESS takes info obtaining during profiling calculates a total run time and generates a report.
*  Input:
*    regular:
*        self:
*    optional:
*        profCaseName: char[1,] - name of profiling case
*           Default: "default"
*
*    properties:
*        profileMode: char [1,] - profiling mode, the following
*           modes are supported:
*             'none'/'off' - no profiling
*             'viewer' - profiling reports are just displayed
*             'file' - profiling reports are displayed and
*                saved to the file
*            Default: 'file'
*
*        callerName: char [1,] - name of caller whose name may
*            be used for generation of total name of profiling
*            case; if it is not given, the name of immediate
*            caller of this function is used
*
*        profileDir: char [1,] - name of directory in which
*            profiling reports are to be saved
*           Default: curent folder
*
*  Output:
*    resTime: double [1,1] - total run time in seconds
*
- Copyright
- 2015-2016 Peter Gagarinov, PhD
2015 Moscow State University
Faculty of Computational Mathematics and Computer Science
System Analysis Department
◆ tic()
| function mxberry::dev::prof::ProfileInfoDetailed::tic | ( | in | self | ) |
TIC starts a stopwatch timer and begins profiling.
*  Usage: tic(self)
*
*  input:
*    regular:
*      self: ProfileInfoDetailed [1,1] - class object
*
◆ toc()
| function mxberry::dev::prof::ProfileInfoDetailed::toc | ( | in | self | ) |
TOC ends profiling and stops the timer, returning the time elapsed in seconds.
*  Usage: resTime=toc(self)
*
*  input:
*    regular:
*      self: ProfileInfoDetailed [1,1] - class object
*  output:
*    regular:
*      resTime: double [1,1] - time between tic and toc
*
Member Data Documentation
◆ StProfileInfo
|
private |
Definition at line 12 of file ProfileInfoDetailed.m.
The documentation for this class was generated from the following file:
- +mxberry/+dev/+prof/ProfileInfoDetailed.m